
 |
GBPAUD Showing Evidence of a Bearish Resumption – Elliott wave analysisTop ↑  July 13 2020
Hello traders, On the weekly chart of GBPAUD we see price declining sharply down from 2.08 high, after a very long but choppy upward movement that was in play for almost 4 years. Price is breaking below the lower corrective channel line which is evidence that further weakness may be seen, espeically as drop is unfolding impulsively. So when looking at a daily chart we expect to see a five wave drop, but that's not the case yet, so more weakness may come after short-term rally up in wave 4 that can stop at 1.846 or maybe even at 1.87/1.88 resistance area. GBPAUD, weekly 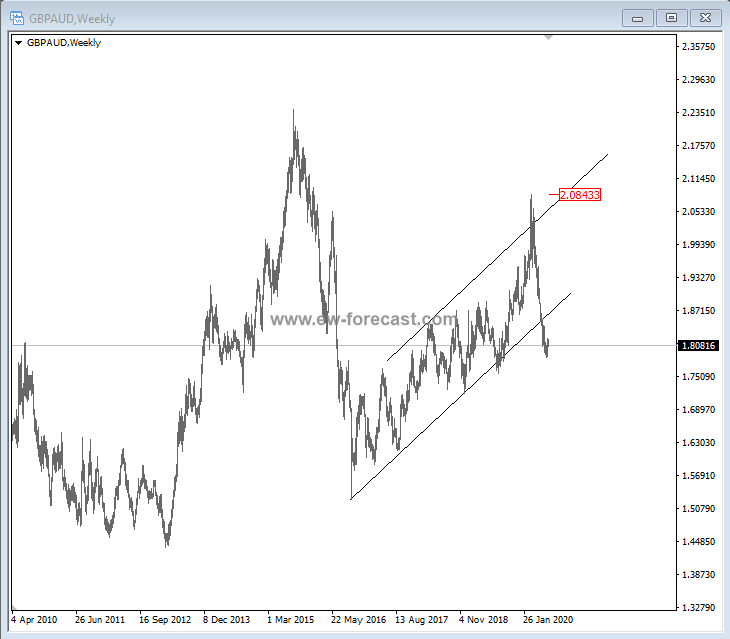 GBPAUD, daily 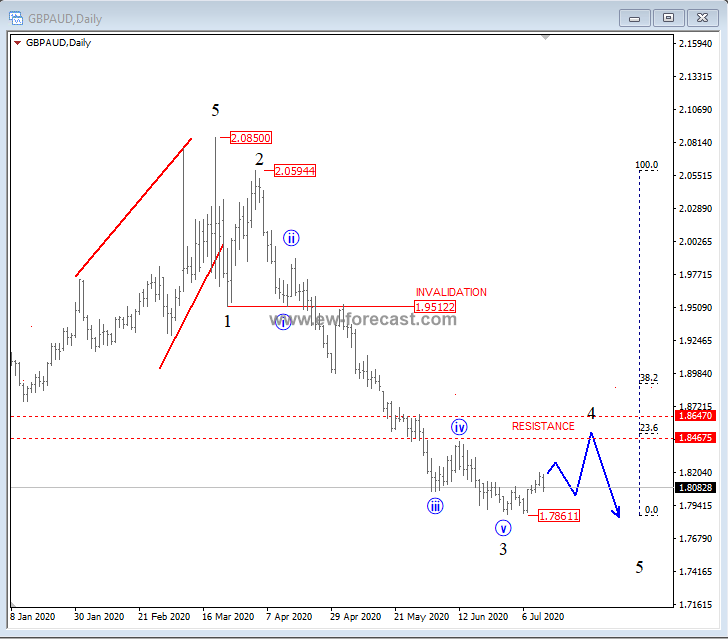 If you want to track the Elliott Wave cycles with us register below. Newsletter archive
|
New York time: 00:00:00
Local time: 00:00:00
| E-mail: | |
HOME
MEMBERS
SERVICE
NEWSLETTER
ELLIOTT SCHOOL
CONTACT
DISCLAIMER
Any reviews, news, analysis, prices or other information contained on our website is provided as general market commentary and delivered electronically through distribution channel to larger number of clients, therefore does not constitute investment advice or investment research. We are not trading advisors. Most of our work is for educational purposes only, with information based on Elliott Wave theory in real time.
Trading forex, futures, options, stocks, cryptocurrenices or any another trading market carries a high level of risk, and may not be suitable for all investors. The possibility exists that you could lose some or all of your initial investment; therefore you should not invest money that you cannot afford to lose. Our website and the information that we provide should not be relied upon as a substitute for extensive independent research before making your investment decisions. In no event will we be liable for any loss or damage on your account in connection with, the use of our products. For any real cash investments you have to contact your financial advisor.
Any information or material contained on our website is owned by Val Global d.o.o.. Reproduction is prohibited without our permission.
Val Global ltd, Dvorjane 7, 2241 Sp. Duplek, Slovenia
| Members area Newsletter |
Services FAQ |
Terms And Conditions Privacy Policy |
||
©2010 - 2020 ew-forecast.com
Design: VOBI